The price of gold faces the strength of the dollar and the challenges of rising US bond yields

It seems that the price of gold is at a crossroads as the weekend approaches, coinciding with the rise of the US dollar and the yields of US Treasury bonds. Traders and investors are anticipating more significant market events, notably the release of Non-Farm Payrolls data later today.
Moreover, the downgrade of the US sovereign debt rating from AAA to AA+ by Fitch has led to increased concerns and a notable decline in market risk appetite.
This sentiment was further exacerbated when Treasury Secretary Janet Yellen criticized the downgrade, describing it as “arbitrary,” but the market seemed to overlook her remarks, resulting in weak and sideways movement in gold prices against the dollar.
Concerns about US debt increased after the US Treasury announced last Wednesday that it would seek to issue $103 billion next week, an increase from the previous $96 billion. The rising cost of borrowing for the Treasury had a more pronounced impact on the yield curve, as investors preferred higher returns given the deteriorating credit risk of the US government over time. This led to a boost in the US dollar during the risk-off sentiment, and the US Dollar Index continued to rise from its lowest level since mid-July.
On the other hand, the market now anticipates that the Federal Reserve is nearing the end of its tightening cycle and may raise interest rates. This expectation may provide upward momentum for gold prices in the medium to long term.
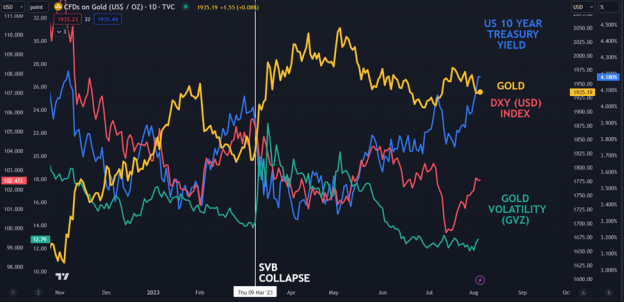
Below is a chart illustrating the GVZ index, which measures the implied volatility of gold and is calculated similarly to how the VIX measures volatility in the S&P 500 index:
The chart was created in Trading View.
From the above illustration, we can observe that the volatility of future gold prices has been diminishing recently, but it has increased in the last few trading hours. This indicates market uncertainty and the possibility of significant price fluctuations shortly.
From a technical perspective, the current gold price is testing the support trendline at $1930, and in the event of a downside break, the next support could be in the range of $1885 to $1895. This price zone includes a series of previous lows, the 200-day Simple Moving Average (SMA), and the 38.2% Fibonacci retracement level of the movement from $1614 to $2062. In the bullish scenario, resistance could be seen at the recent peak level of $1950, followed by stubborn resistance at $2000.


